New Tracks in SportTracks
The maps in SportTracks now display metrics and intensities!
The maps in SportTracks just received a fairly significant upgrade! The next time you visit a workout detail page, be sure to check out these new map features:
- Expand to full screen
- Color-coded map tracks with workout metrics and intensities
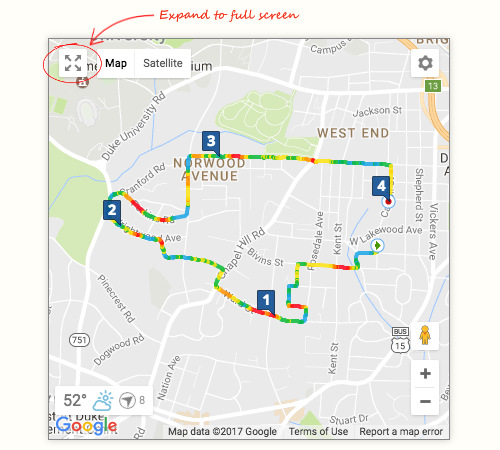
Expand to full screen
Nothing revolutionary here, just a simple button to expand your workout map to fill the entire screen:
Collapsing is as simple as hitting the similar looking  button.
Obviously, this is just a simple utility, but for longer runs and rides it's incredibly useful for gaining a better understanding of the ground you covered. It gets even more useful when you dig into the next feature...
Color-coded map tracks
Did you notice the rainbow-striped line in the image above? Those are the new map tracks that display various workout metrics and intensities. You can change what metric is displayed by selecting the gear icon in the top right corner of the map:
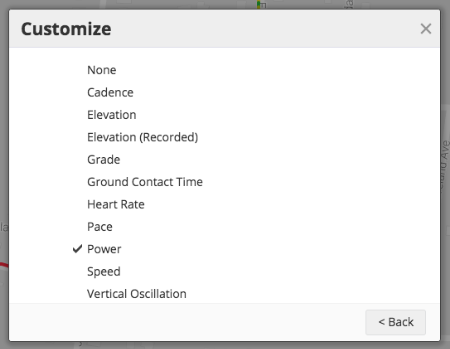
This opens a list of metrics that you can select to overlay on your tracks. On this particular run, I was wearing a heart rate monitor and an Stryd running power meter, so I have many options to chose from.
Once you've selected the metric you want to see, hit the Close button. You'll be brought back to the map with the selected metric on your tracks. The different colors you see represent various intensities. Here's our route intensity key:
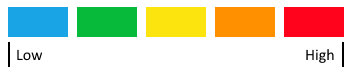
As you can see, it works like this:
- Blue is the easiest intensity
- Green is one step higher than the easiest
- Yellow is the middle intensity
- Orange is one step higher than the middle
- Red as the highest intensity
Our new mapping features works across multiple sports (running, cycling, etc). Any activity that has multiple metrics to review is included.
We hope you like these new features, and that they help you more effectively analyze your workouts! If you have any questions or thoughts, we would love to hear them in the Comments section below...
| Article written by Sam Mallery, Director of Marketing, Zone Five Software Inc. |
Comments
Does grade know when I go down or up? Is it green on a descent and red on red on the ascent?
Yes. Green is always low. Since negative grade is low it will be green on descent, and red on ascent.
This is interesting. I missed the full screen addition but noticed the rainbow route lines and wondered what they were. They obscure what used to be the red highlight of a segment in the analysis section, however. Can that be fixed?
You can select "None" from the intensity drop down
Do the colours correspond to particular zones or is it all relative?
Take for example heart rate. Do the colour zones correspond to the zones I set up in my profile settings?
I figured it out. The zones are all relative to the minimum and maximum recorded data for that session.
Yes indeed. It would really love to this function to correspond to Zones instead of the workout itself in order to compare apples with apples.
Really nice! Thanks for implementing this.
Hi! Is it possible to implemtent this feature in the "offline" version of sporttracks?? Greetings!
How does this work when you're doing an out-and-back or laps? Will it show the colour for the last time you passed that point or some kind of average?
Nice. I was really looking forward for this feature. Thanks
This is nice, but it would be more helpful (to me, at least) to have the colors correspond to the zones I have set up for each metric. Or the ability to set the parameters ourselves for each map if it's too hard to use our personal zones.
I used to be able to see gradients when scanning across the "hounds tooth" display. It doesn't do that anymore. Am I missing something?
Hello , is it possible to see a map with all avtivities ?