Battle of the Swim Apps
Why SportTracks is the hands-down best app for your swim performance
Last week we introduced our new features for advanced analysis of pool workouts. This week we take a look at how we stack up with a head-to-head comparison of several alternatives. Announcing…
The Pool Software Cage Match!
(three apps enter… one app leaves)
Garmin Connect
If you’re not familiar with Garmin Connect – it’s the software that comes with your Garmin watch. For basic logging: it pretty much works. For anything advanced: you’re going to hit walls really quickly (and naturally, that’s where we come in).
Garmin Connect has been through a tough update recently. The last update on their facebook page was almost a month ago.
Ouch. So we had to struggle a bit with website lockups, browser crashes and site errors while putting together screenshots. Since then it's been a bit quiet but we have complete faith that the technical team is working hard to fix these issues and get it under control.
Garmin makes three watches that record pool strokes: Forerunner 910XT, Fenix2, and Garmin Swim. It would be pointless to record all this info and not even show it on their website, so obviously they have support for swim stroke analysis.
To test this out, I’ve imported a pool workout recorded on a 910XT. The workout starts with breaststroke/freestyle intervals, has a section of drills, and finishes with freestyle. Let’s see how the data is presented.
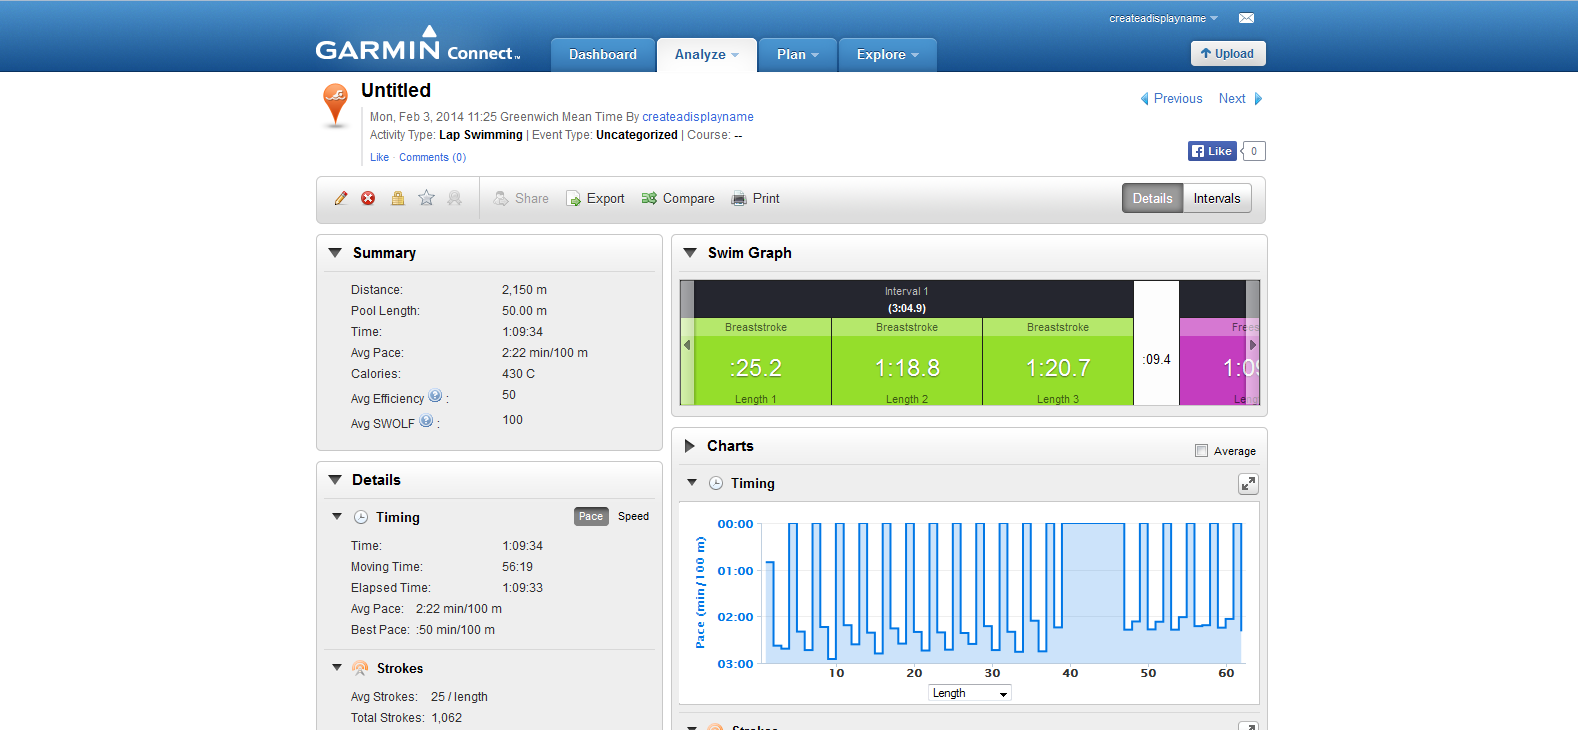
Garmin Connect is built on older technology, so the first thing you’ll notice is the page is scrunched up into a small vertical strip in the center. Not a very good use of my wide monitor (and don’t even try this on your tablet or mobile phone).
You can find the summary info on the left side, and a small pace chart on the right. You’ve got choices of Time and Length for the x-axis which is nice (just like SportTracks).
There is a pretty horizontal scrolling strip at the top showing you your lengths. But it’s a bit awkward to use – I had to click the right button 12 times to scan through the numbers for my workout. This looks like one of those things that the visual designers dreamed up without really testing how people would use it on long swims to effectively track their performance numbers.
To see more charts, you’ll need to scroll your webpage down:
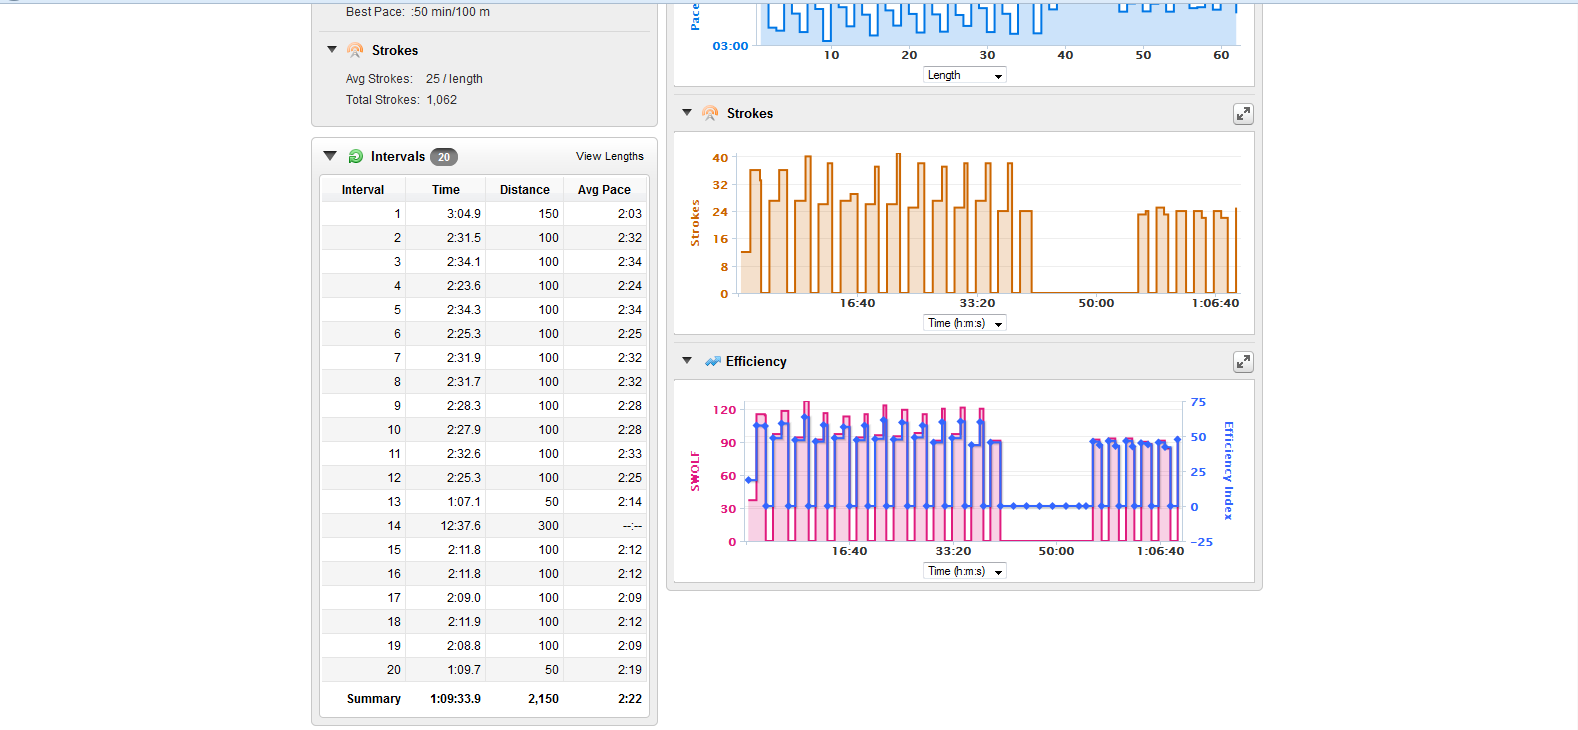
Here we can see two more charts: Strokes /per length and SWOLF/Efficiency. I can zoom in on these charts… kindof… but no overlay of data is possible. So to visually compare pace and strokes, you’ll find yourself scanning vertically between two charts, trying to align exactly which length you’re interested in.
The left side has an overview of the intervals data, but it is pretty basic: time, distance, and pace. Fortunately there is a button to switch to lengths to show more data for each interval:
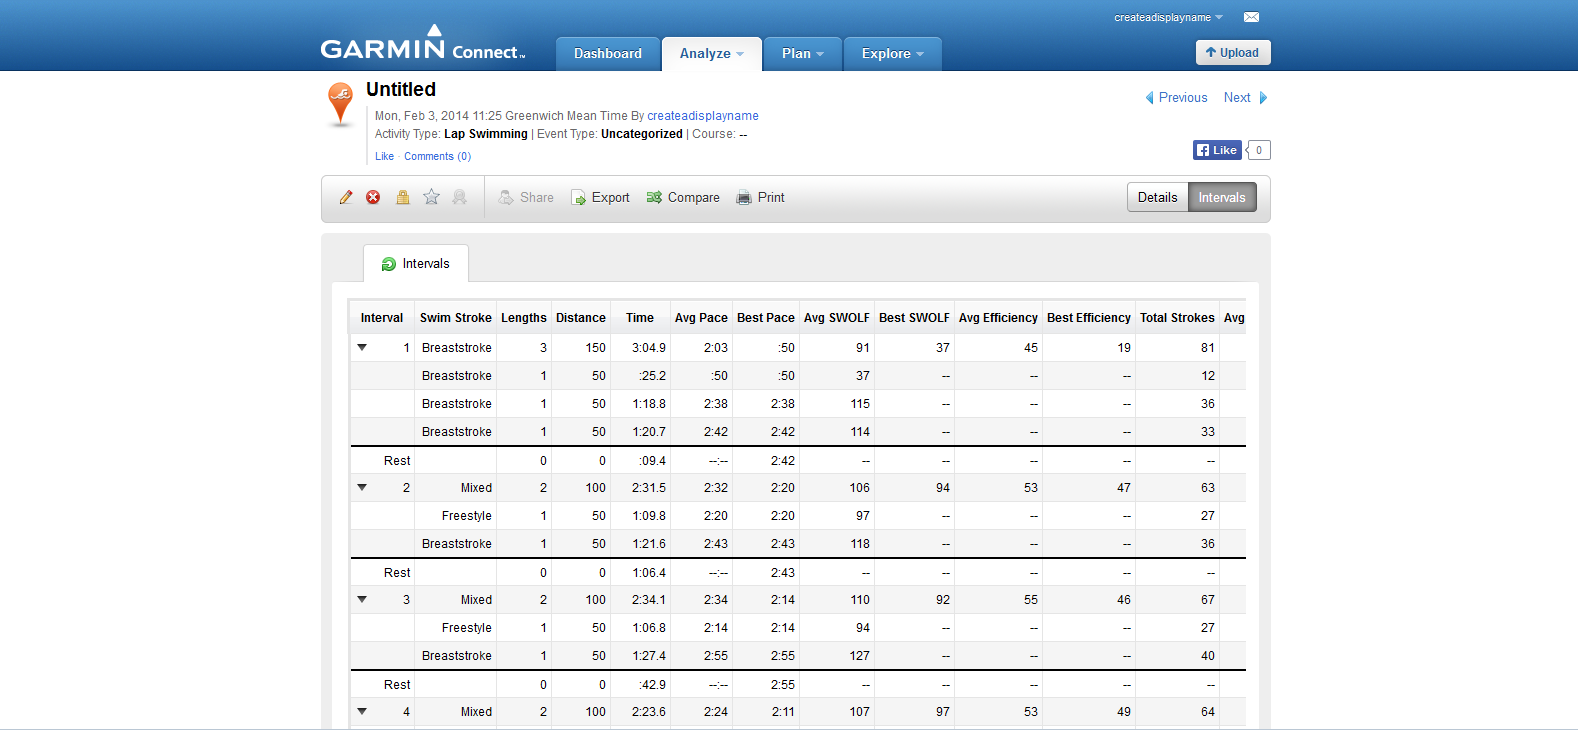
…which drops into a new page. To see lengths I need to click each interval to expand. One. At. A. Time. Unfortunately now I can’t see my charts or any visual representation of the other data. Basically it’s just a big spreadsheet. Which is fine… if you’re an accountant. And if I want to click back to the summary, I wait for the website to refresh – about 10 seconds.
A few other poor choices were made here such as putting rests in their own rows even though the only relevant data is rest time – a big waste of space. The table also seems to cut off some data to the right, which I need to scroll to get to, but to get to the scrollbar I need to scroll down, then scroll to the right, then scroll back up to the length I was looking at – if I can remember where I was. If that previous sentence sounded confusing you have a good feel for what I went through.
For comparison, here is the same workout in SportTracks:
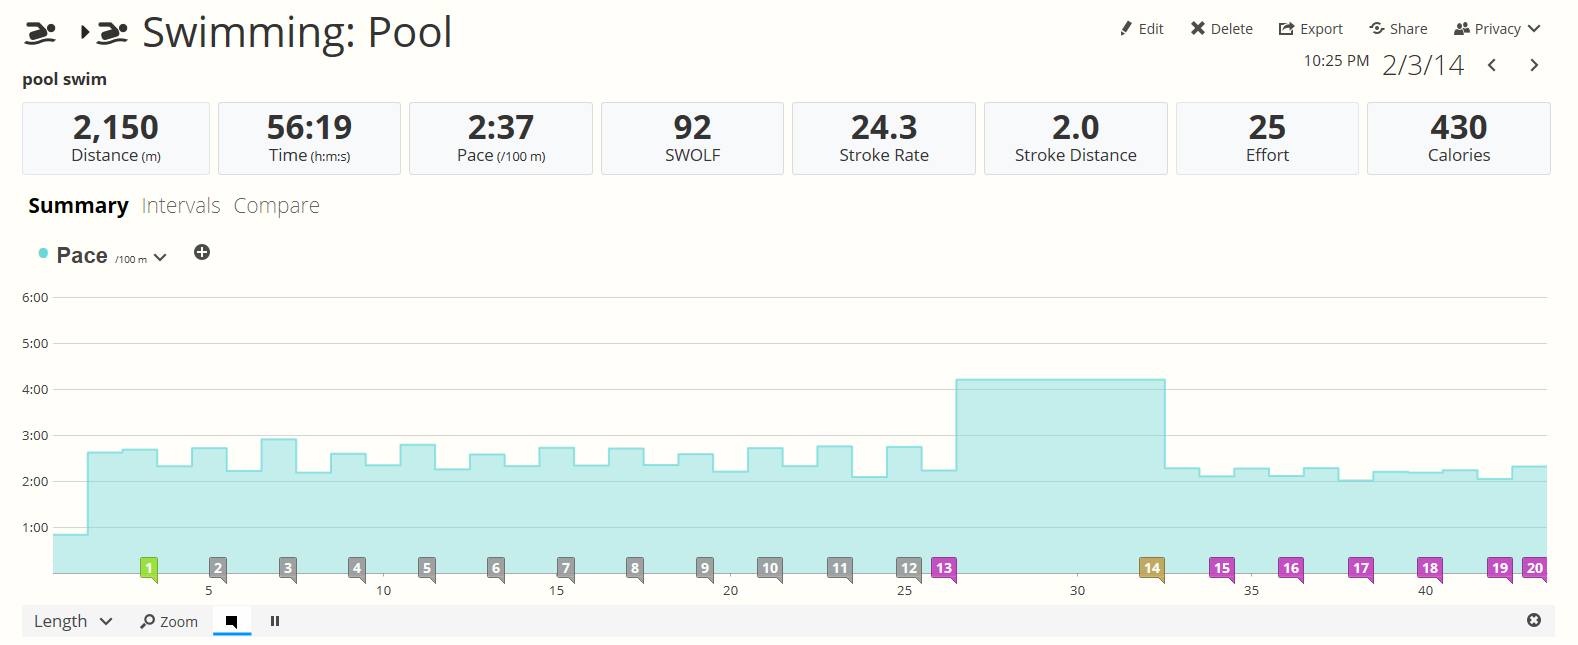
I’ve got much of the same data in a tidy single page view that fits on my monitor, and uses the whole width of the screen. I can overlay different data on the chart. I can hover to get more detail, or select a segment for detail on that section. I can show summary stats for intervals, and even sets. In other words, I can really explore my data interactively.
The intervals view gives me info for lengths, which I can show charts for, or summarize by intervals or sets:
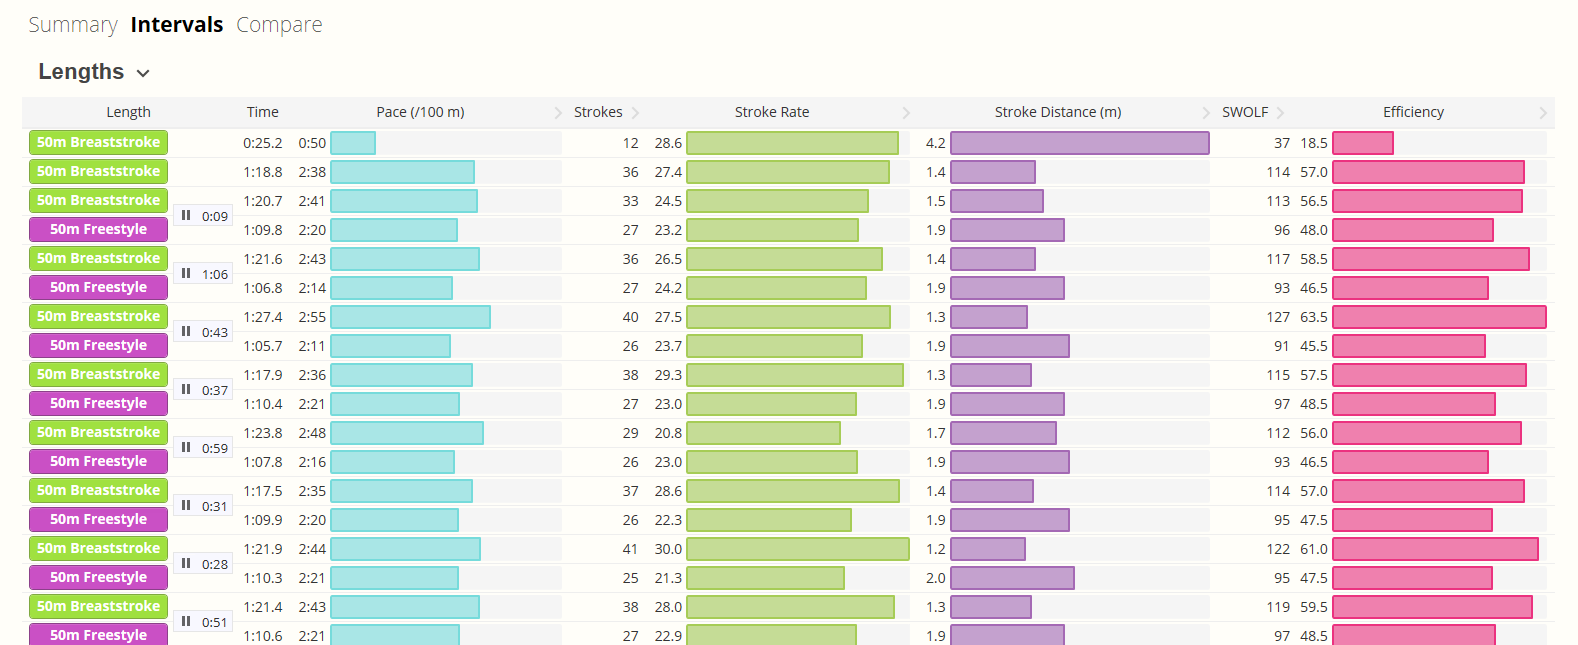
Here I can see 18 lengths at once, instead of the 7 possible in Garmin Connect. And once the workout is loaded, switching pages is instantaneous. No waiting if I want to go back to the chart view, or enter notes, or tag the gear I used.
How does SportTracks improve on Garmin Connect?
- Use your whole screen to show you as much information as possible
- Show all your data in charts, not just a table of numbers
- Overlay multiple performance numbers on a single chart
- Show segment statistics interactively on chart
- Summarize your performance for sets, not just lengths or intervals
- Efficiently see performance on length and intervals without constantly scrolling
- Switch between different views without having to wait, wait, wait
Training Peaks
Training Peaks is an online platform designed for triathlete coaches. Since independent athletes can use it too, we decided to see how it performed compared to Garmin Connect and SportTracks. Does it provide useful tools to see your performance? Or does it just try to get to the bike section without drowning? (LOL, that’s a triathlon joke… get it?)
For this demo we use the EXACT same .FIT file which was recorded on the 910XT for the tests above.
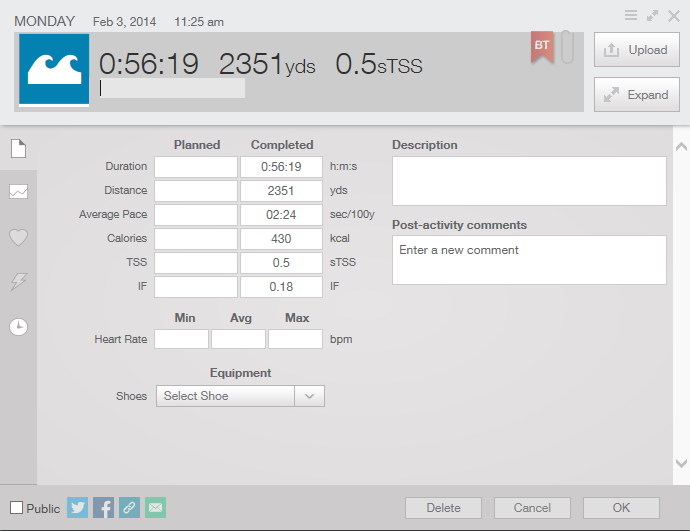
Good news! It does recognize the FIT file and seems to import the basic data. Bad news: It didn’t recognize that I swam in a 50 meter pool. So it’s showing 2351 yards which I suppose is technically right, but not very friendly. A minor quibble.
The website has calculated my sTSS score as 0.5 and IF score as 0.18. It’s nice to know I have the equivalent of 0.5 snake hissing noises for this swim (stssssss…). It also wants me to pick the shoes I swam in. I don’t usually swim with shoes, but I suppose some others do. (Side note: Is there a difference between “fins” and “flippers”? If you know, please leave a comment)
Click the chart icon to see details:
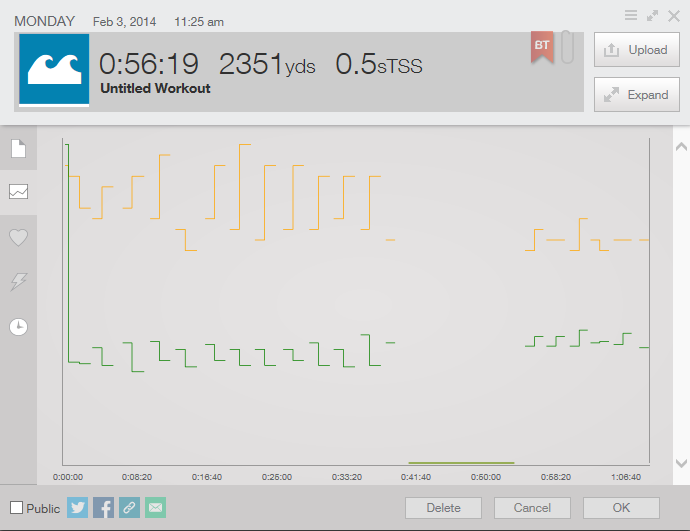
Ok… here's my yard full of snakes. Some of them are laying on their left side, some on the right, except that sad green snake at the bottom. I wonder what’s up with him? He must be sleepy. Moving my mouse over the chart I can inspect my snakes:
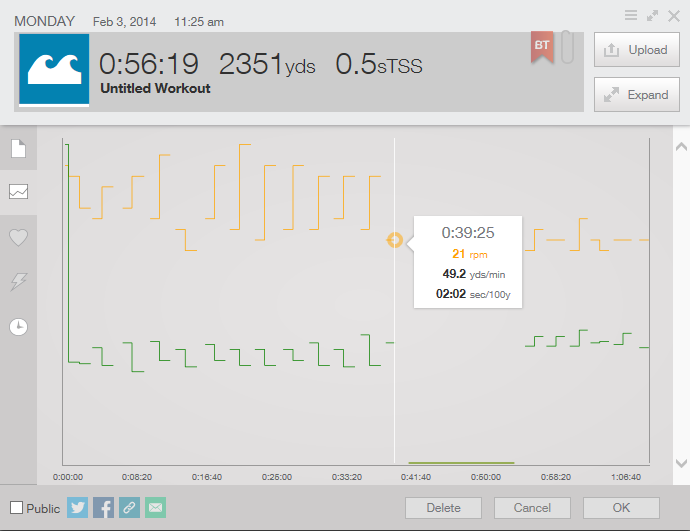
Ahah! This is my pace and cadence chart. I can tell it’s cadence because the app says my arms spun around at 21 RPM. We also have two pages for heart-rate and power:
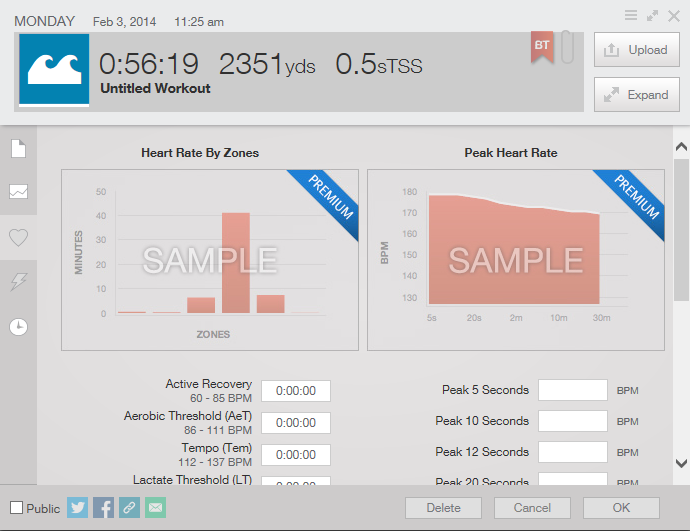
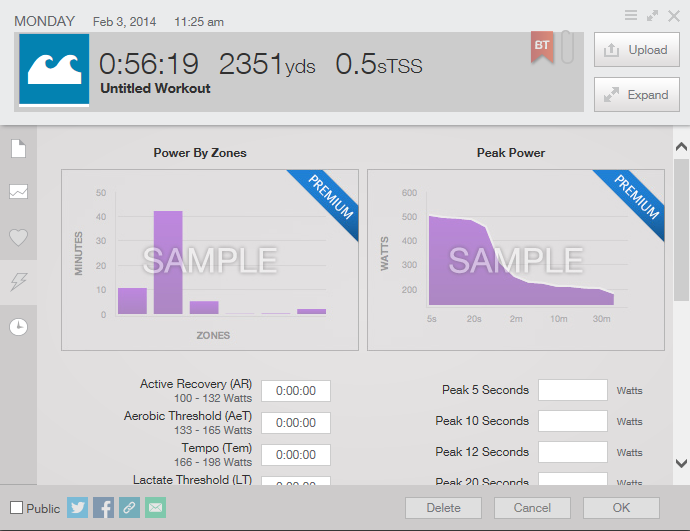
Oh TP… you cheeky vagabond… you’re such a tease!!!
To see my laps and intervals you’ll need to click the expand button. You can click the button labeled “Expand” or the expand button in the page title – both do the same thing.
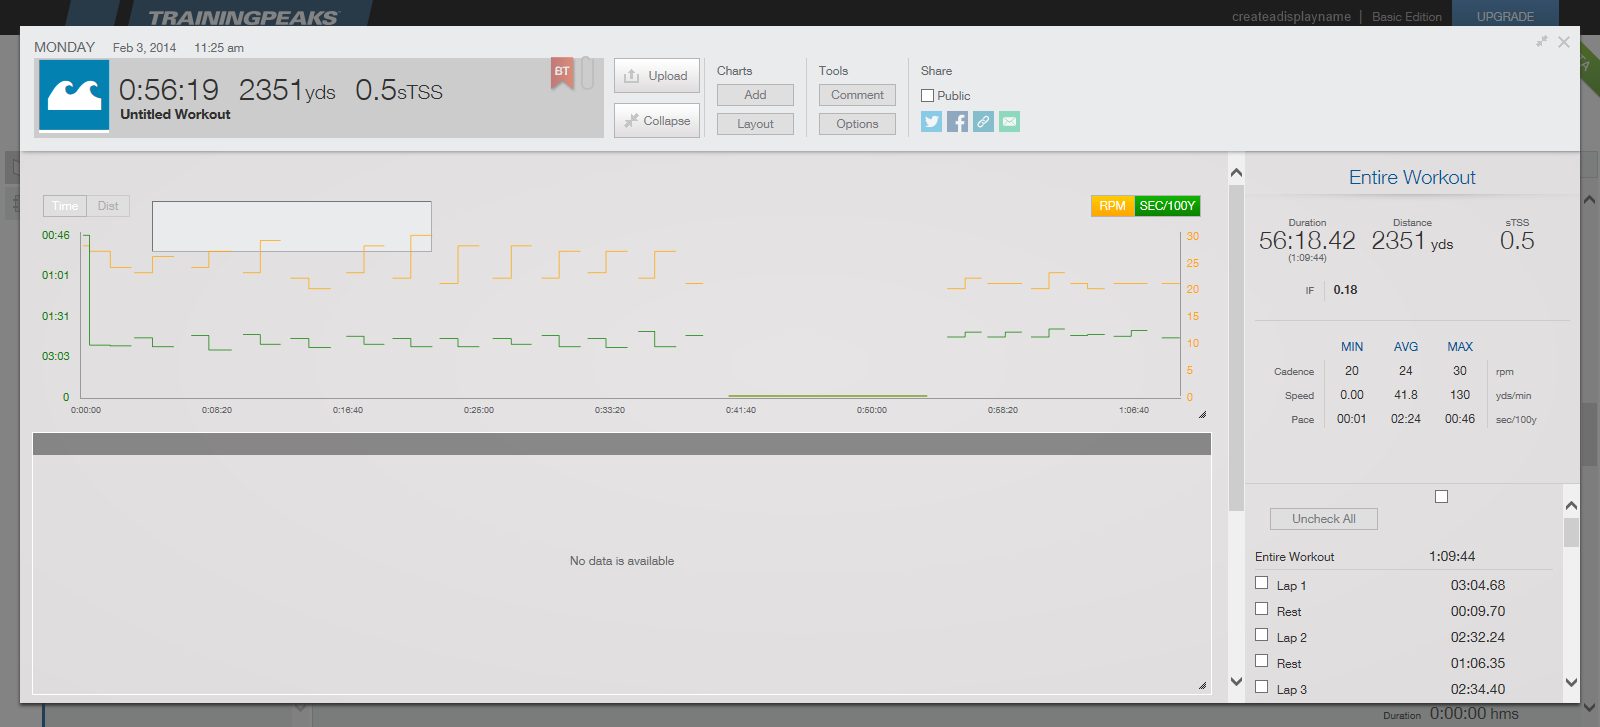
Most of this page is dedicated to the somewhat insulting claim “No data available” which is clearly not true as I’ve seen the data in both Garmin Connect and SportTracks. My assumption here is that the data simply was not imported. A pity. And you’ve hurt my feelings.
You can see very basic interval info hidden down in the far right. Just the lap duration. Nothing else. There is also an unlabeled checkbox hanging out wanting to play that you can click to get more…
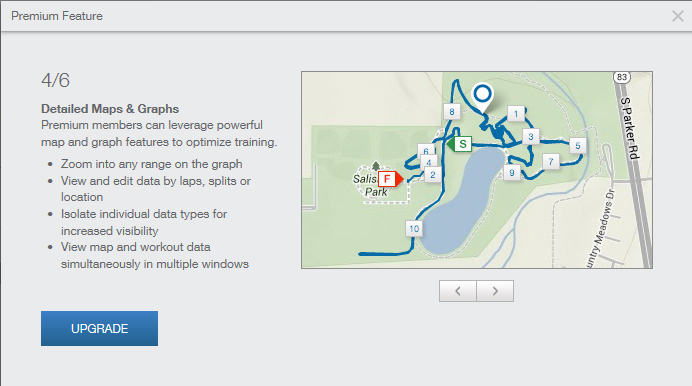
…feature upgrade dialogs. I get the same dialog trying to select in the chart to zoom in, also clicking various chart buttons. Zooming in on your workout data is a premium feature.
How does SportTracks improve on Training Peaks?
- See the distance of the pool you actually swam in
- Store all of your recorded pool stroke data and performance info
- Ability to zoom into charts, overlay more chart metrics
- Detailed info on intervals, sets and lengths
- Analyze your pool workouts as pool workouts, not bike rides in the water
- Doesn’t think your arms are wheels and you swim with shoes
And the others?
Swimsense has a website which only works with Swimsense devices. It’s actually quite good (although not as good as SportTracks). But if you’ve got a Garmin, a Suunto Ambit2 or TomTom there really are no other online options. And hopefully now we’ve convinced you SportTracks is THE ONLY option.