Last fall Garmin® announced the Forerunner® 620, along with a new line of heart-rate monitors with an embedded accelerometer. One of the exciting new features is something Garmin has called "Running Dynamics".
Using the new HRM your Forerunner can detect how much your torso bounces up and down while you run, and... with a little math... how much time your foot is in contact with the ground. Garmin has called these two new metrics "Vertical Oscillation" and "Ground Contact Time" (rather geeky, but who asked me?).
The idea behind measuring these two metrics is simple. Your objective as a runner is to move forward, as efficiently as possible. Movement up and down is wasted effort. And research of elite runners has shown they spend less time in contact with the ground.
I need those running metrics now!
You may remember a classic photo from a few years back showing a Kenyan runner, both feet off the ground, "flying." That's the idea with ground contact time. Be like the Kenyan. Fly. Dr. Jack Daniels explains further in this Garmin video:
Running dynamics in SportTracks
With the website update yesterday, we now fully support these two metrics, including some new analysis features you won't see anywhere else.
If you have a Forerunner 620, simply import your .FIT file as usual. Click your workout, and on the detail page select the two metrics in the chart:
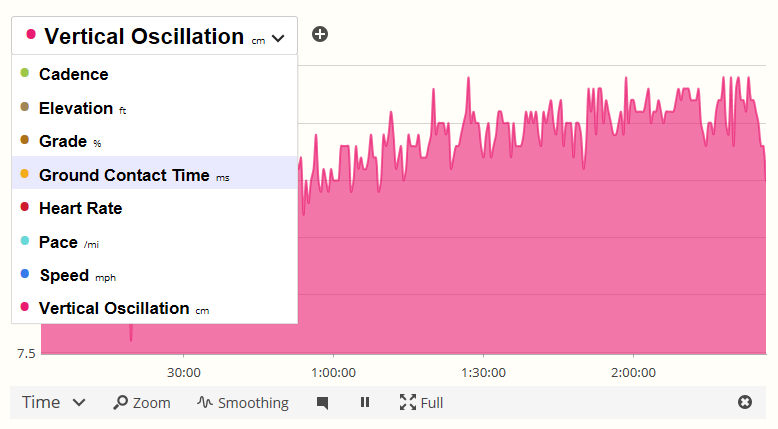
As with all other metrics you can use the overlay feature to really dig into what's going on with your running efficiency by combining views of Pace, Cadence, Vertical Oscillation and Ground Contact Time.
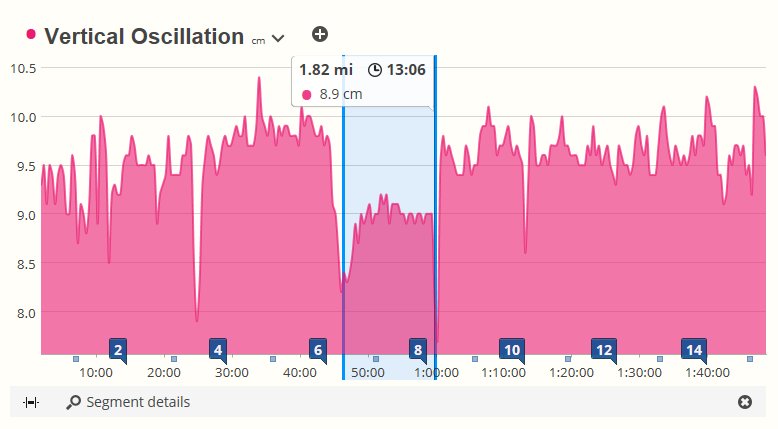
And as you would expect, you can also click markers for miles, kilometers, recorded laps and hills to get summary info for the segment, or drag across the chart to get statistics for any arbitrary section you care about, just like every other metric:
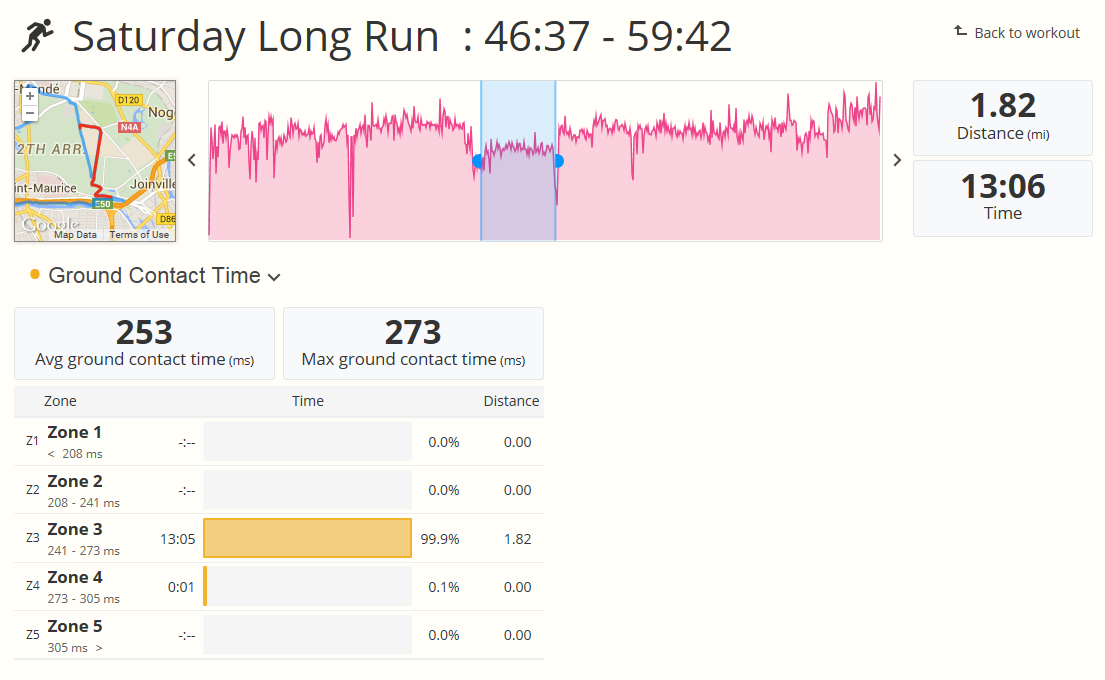
Switching over to the Analysis page, you'll notice we've added three new zones for Cadence, Vertical Oscillation and Ground Contact Time. The zone ranges give you an indication of where you are compared to beginner, average, and elite runners. Remember the guides above - faster Cadence, lower Oscillation, and less Ground Time are generally considered "better".


We've conveniently lined up these zones to match the same rainbow ranges on your Garmin 620 watch (purple, blue, green, orange, red).
As with all other data metrics your Forerunner 620 records, these same zone metric charts are fully supported on the segment detail page as well. This allows you to see actual data on how your running form changes on uphill versus downhill or varying terrain if you're a trail runner. You can easily see differences from the start of the run compared to the end of the run; a possible indication your running form is changing due to fatigue. Good stuff.
You'll see a detailed tutorial on segment analysis of running dynamics in a future post - this is a feature you can only get on SportTracks.